You run the reliability analysis and alpha comes back at 0.58. Your supervisor says the scale fails. You open the Item-Total Statistics table and have no idea which column to look at, which item to drop or how many you are allowed to drop. This guide covers Cronbach’s alpha in SPSS from the clicks to reading each column, the rules for removing items, six reasons alpha comes out low, and how to report it in your thesis.
1What is Cronbach’s alpha?
Cronbach’s alpha (Cronbach, 1951) measures the internal consistency of a scale: whether the items meant to measure one concept move together. It usually runs from 0 to 1 (it can go negative when something is wrong with the data), and the closer to 1, the more consistent the items are.
- Run it separately for each construct, never on the whole questionnaire.
- Alpha rises with the number of items, so long scales get a head start.
- A high alpha does not prove a scale measures the right thing. That is the job of EFA and CFA.
2What is a good Cronbach’s alpha?
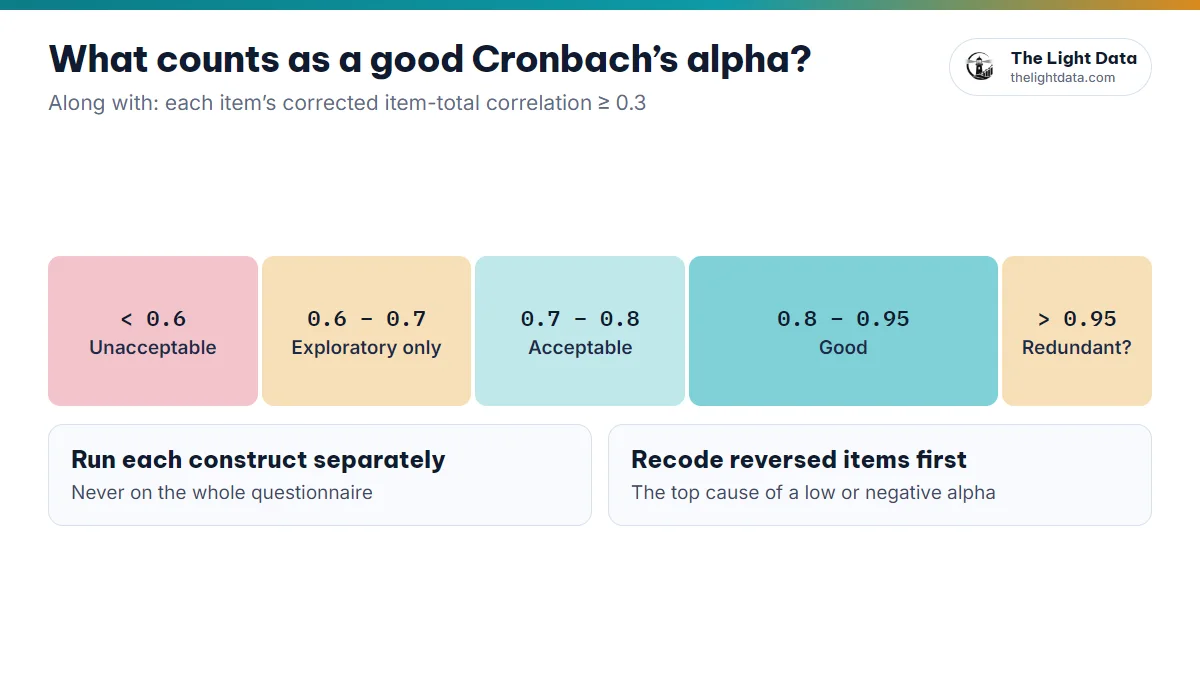
- ≥ 0.8: Good
- 0.7 to < 0.8: Acceptable, the usual benchmark (Nunnally & Bernstein, 1994)
- 0.6 to < 0.7: Acceptable for exploratory research or new concepts (Hair et al., 2019)
- < 0.6: Unacceptable
- > 0.95: A warning sign that items may repeat each other
There is one more condition: each item’s corrected item-total correlation should be at least 0.3.
3How to run Cronbach’s alpha in SPSS
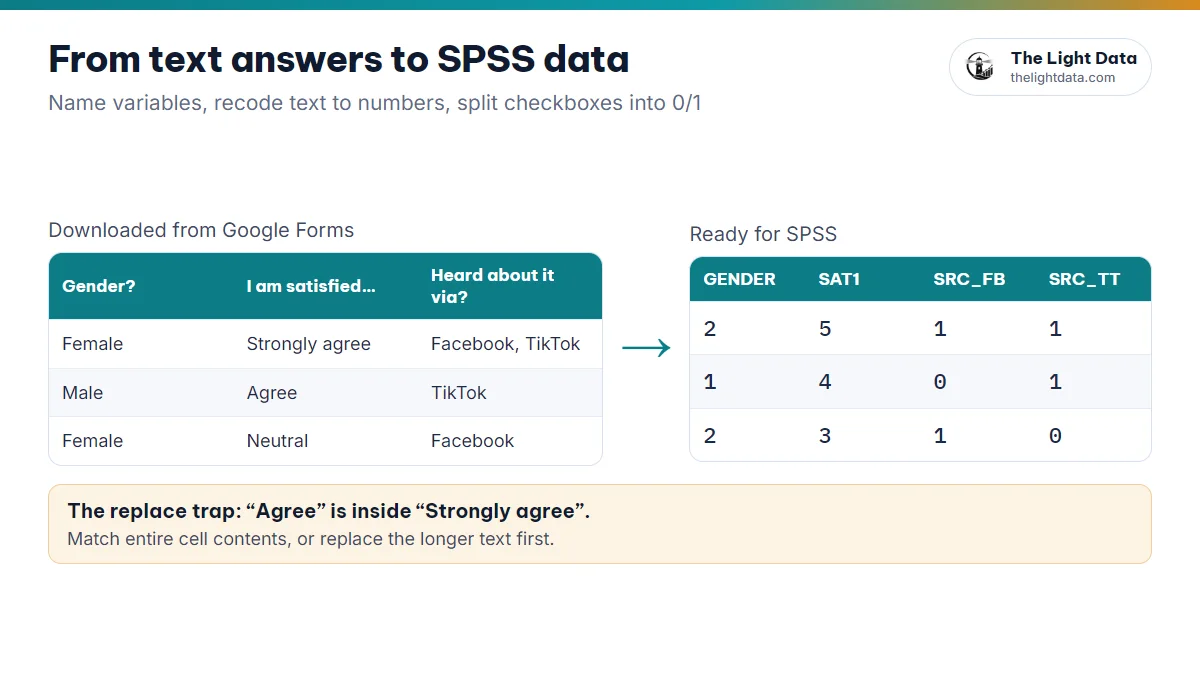
Check the data is numeric, 1–5 in the right direction, and that reversed items have been reverse-coded. This is the top cause of a low or negative alpha.
- Analyze→Scale→Reliability Analysis
- Move the items of one construct (say, SAT1–SAT5) to the Items box. Model: Alpha.
- Click Statistics and tick Item, Scale and Scale if item deleted, then Continue and OK.
- Repeat for each remaining construct.
4Reading the Cronbach’s alpha output: which column matters?
The Reliability Statistics table gives you the overall alpha. The Item-Total Statistics table shows how each item contributes:
| Column | What it tells you |
|---|---|
| Scale Mean if Item Deleted | The scale’s mean without this item; rarely used to decide |
| Scale Variance if Item Deleted | The scale’s variance without this item; rarely used |
| Corrected Item-Total Correlation | How this item correlates with the rest: should be ≥ 0.3 |
| Cronbach’s Alpha if Item Deleted | The new alpha without this item: if it is clearly higher, this item is dragging the scale down |
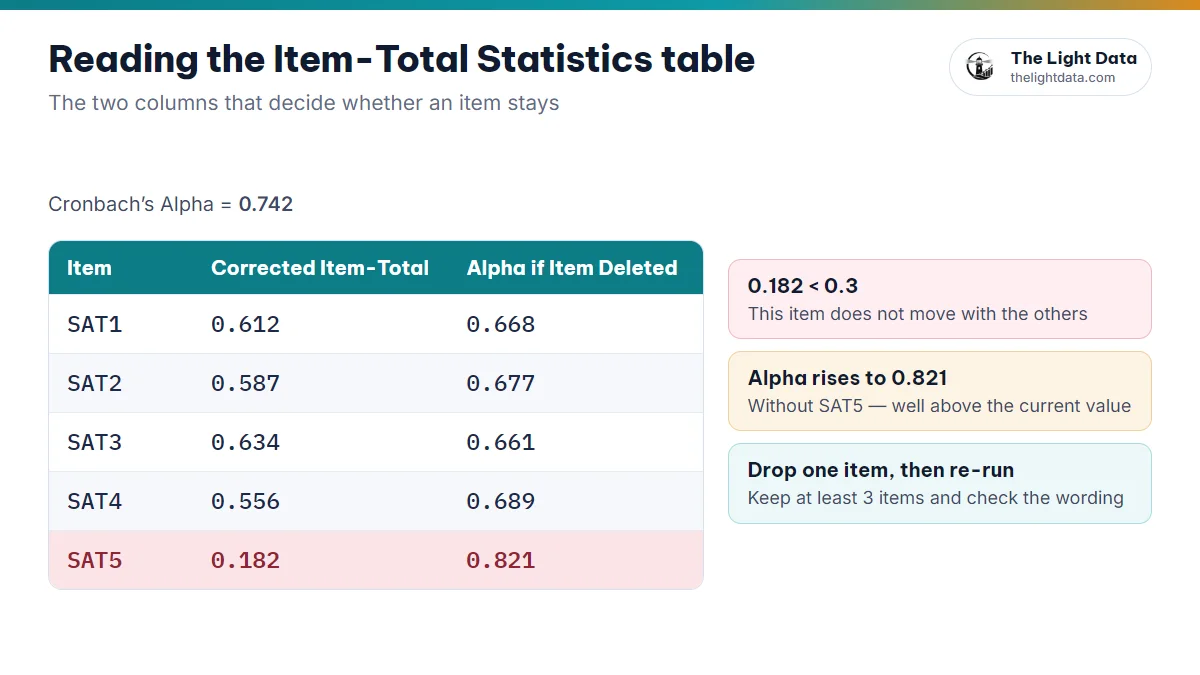
Cronbach’s alpha = 0.742.
| Item | Corrected Item-Total | Alpha if Item Deleted |
|---|---|---|
| SAT1 | 0.612 | 0.668 |
| SAT2 | 0.587 | 0.677 |
| SAT3 | 0.634 | 0.661 |
| SAT4 | 0.556 | 0.689 |
| SAT5 | 0.182 | 0.821 |
SAT5 has an item-total correlation of 0.182 (below 0.3), and removing it lifts alpha to 0.821. Consider dropping SAT5 and re-running with the other four.
5How to remove items properly
- Remove one item at a time, starting with the lowest item-total correlation, then re-run, because the remaining results will change.
- Keep at least 3 items per construct.
- Read the question before you drop it: if it covers a core part of the concept, explain why you keep it or look for another cause.
- Do not remove items just to gain a few points of alpha on a scale that already passes.
- Record which items you removed and why. Your committee will ask.
6Low Cronbach’s alpha: 6 causes and fixes
| Cause | Fix |
|---|---|
| Reversed items not reverse-coded | Recode 1↔5, 2↔4 and re-run; alpha often jumps |
| Wrong coding (such as Automatic Recode on Likert) | Check Frequencies for each item and recode in the right direction |
| One item off-topic or confusing | Check the corrected item-total and consider removing it as in section 5 |
| The scale actually measures several aspects | Run EFA to see whether it splits into 2 factors |
| Too few items (only 2) | Report the correlation or Spearman–Brown; design at least 3 next time |
| Translation shifted the meaning | Compare with the original scale; note it as a limitation |
Never edit, delete or add responses to make alpha look better. If a scale still fails after proper handling, report that honestly and discuss it under limitations. That is a legitimate result too.
7How to report Cronbach’s alpha in your thesis
Present one summary table for all constructs:
| Construct | Items | Cronbach’s alpha | Lowest item-total correlation |
|---|---|---|---|
| Service quality (SQ) | 5 | 0.864 | 0.592 |
| Perceived value (PV) | 4 | 0.812 | 0.548 |
| Satisfaction (SAT) | 4 (SAT5 removed) | 0.821 | 0.601 |
“The results show that all scales had a Cronbach’s alpha above 0.7 and that all item-total correlations exceeded 0.3 (Nunnally & Bernstein, 1994). Item SAT5 had an item-total correlation of 0.182 and was removed; alpha for the Satisfaction scale then rose from 0.742 to 0.821. The remaining items were carried forward to exploratory factor analysis.”
Practice reading the tables before your data is in
Have not finished collecting, but want to see what the alpha, rotated matrix and regression tables will look like for your model? On The Light Data’s model canvas, draw your model, pick SPSS and read the full set of result tables on simulated data. Simulated data is for learning only and never replaces real survey data.
- Alpha ≥ 0.7 (≥ 0.6 for exploratory work) and item-total correlation ≥ 0.3.
- Run each construct separately; reverse-code reversed items first.
- Remove one item at a time, keep at least 3, weigh the content and record your reasons.
- Items that pass move on to EFA.