Cronbach’s alpha passed, so you confidently run the EFA and get back a mess: items from factor A in factor B’s column, one item loading on two columns, a different number of factors from your model. This guide covers exploratory factor analysis in SPSS step by step: the conditions, the clicks, how to read the four tables that matter, and how to clean up the rotated matrix so the result stands up in front of your committee.
1What exploratory factor analysis is and when you need it
EFA groups observed items that correlate strongly into factors. That lets you check convergent validity (items of one factor load strongly on it) and discriminant validity (they do not load strongly on other factors).
2Conditions before you run EFA
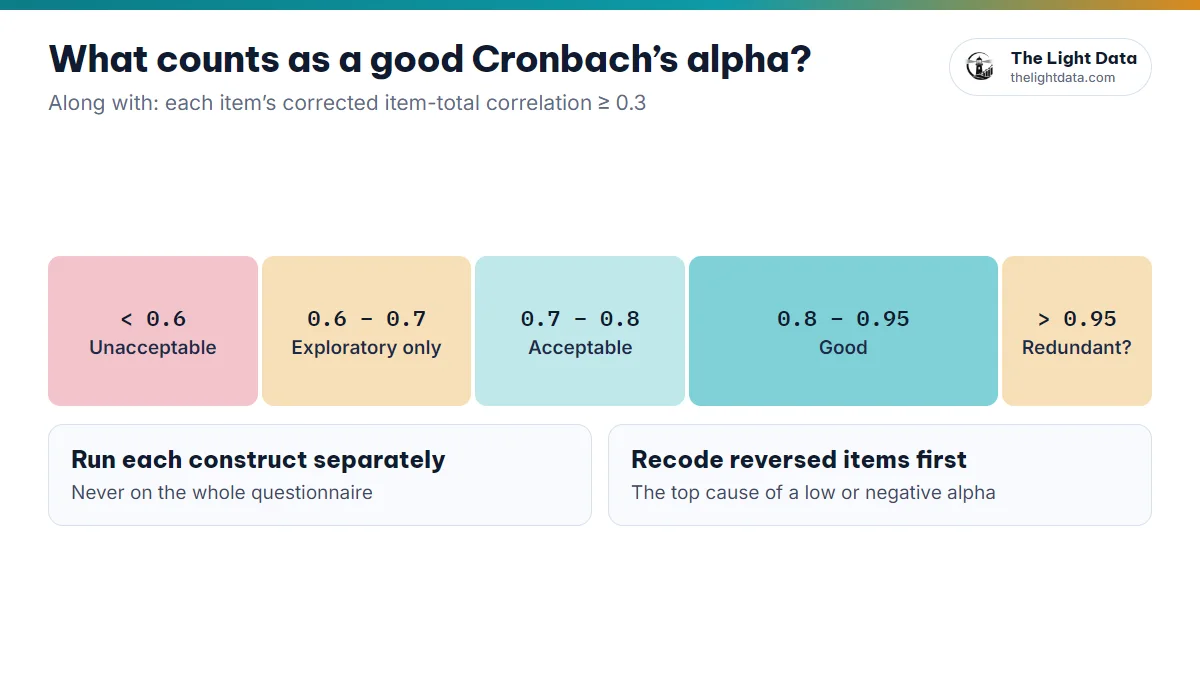
- Include only items that passed Cronbach’s alpha.
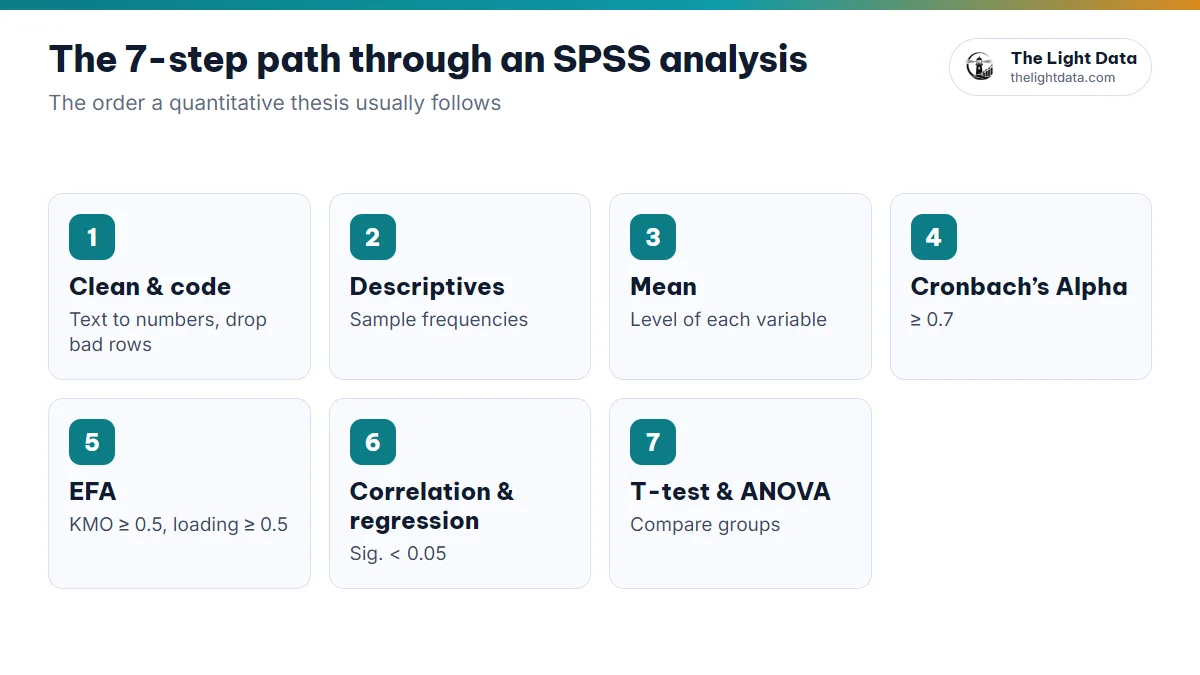
- Sample size of at least 5 responses per item, and preferably 10 (Hair et al., 2019).
- Use quantitative or Likert items only; leave demographics out.
For regression models it is common to run EFA separately for the independent variables and for the dependent variable. When preparing for CFA or SEM, many authors run all scales together.
3How to run exploratory factor analysis in SPSS
- Analyze→Dimension Reduction→Factor
- Move the items to the Variables box.
- Descriptives: tick KMO and Bartlett’s test of sphericity.
- Extraction: Method Principal components (regression) or Principal axis factoring (preparing for CFA), Based on Eigenvalue > 1.
- Rotation: Varimax (with Principal components) or Promax (with Principal axis factoring).
- Options: Sorted by size and Suppress small coefficients at 0.3.
Hide everything under 0.5 and you cannot see the cross-loadings between 0.3 and 0.5, which are exactly what you are looking for. See them first, then decide.
4Reading the 4 EFA tables that matter
① KMO and Bartlett’s Test
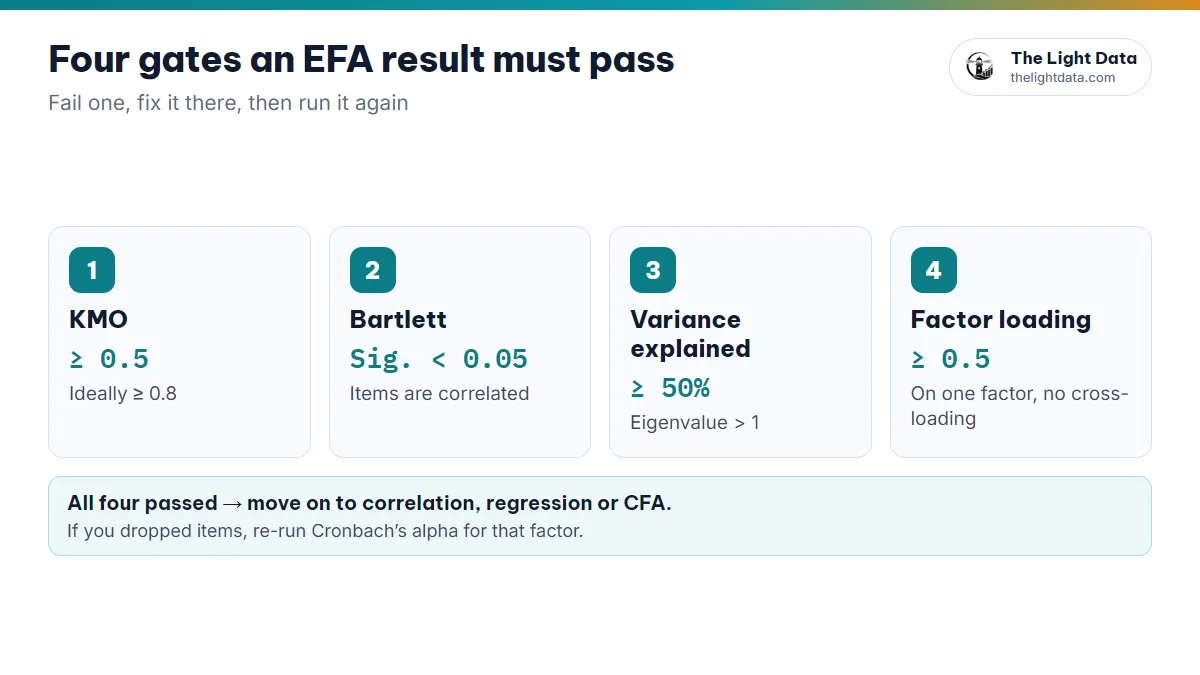
- KMO ≥ 0.8: Good · 0.5 to 0.8: Acceptable (Kaiser, 1974)
- KMO < 0.5: The data is not suitable for factor analysis
- Bartlett Sig. < 0.05: Items are correlated enough for EFA
② Communalities
How much of each item’s variance the factors explain. An item with a very low communality (under about 0.5) usually also loads weakly, so it is one to look at.
③ Total Variance Explained
- Eigenvalue > 1: The rule for keeping a factor
- Cumulative % ≥ 50%: The factors explain enough of the variance
④ Rotated Component Matrix
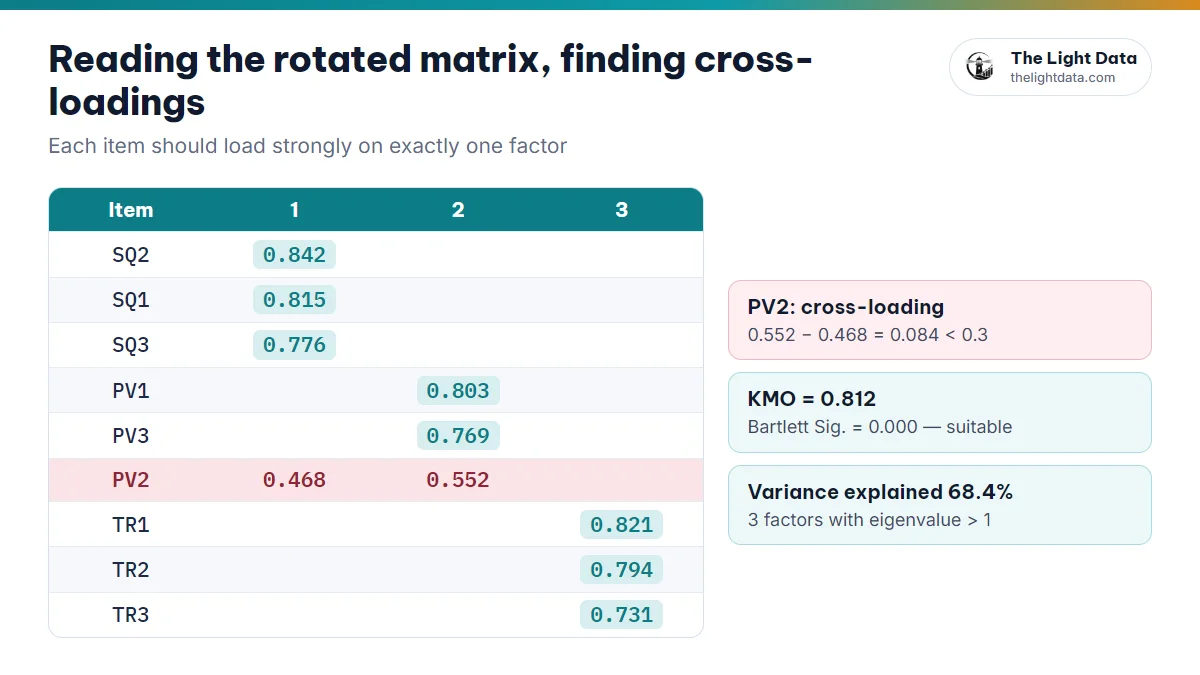
The most important table. Each item should load strongly on exactly one factor:
- Loading ≥ 0.5: The common threshold
- By sample size (Hair et al., 2019): about 0.30 at n = 350, 0.50 at n ≈ 120, 0.75 at n = 50
| Item | 1 | 2 | 3 |
|---|---|---|---|
| SQ2 | 0.842 | ||
| SQ1 | 0.815 | ||
| SQ3 | 0.776 | ||
| PV1 | 0.803 | ||
| PV3 | 0.769 | ||
| PV2 | 0.468 | 0.552 | |
| TR1 | 0.821 | ||
| TR2 | 0.794 | ||
| TR3 | 0.731 |
KMO = 0.812; Bartlett Sig. = .000; 3 factors with eigenvalues above 1, explaining 68.4% of the variance. But PV2 loads on both factor 1 (0.468) and factor 2 (0.552), a gap of only 0.084. That is a cross-loading to deal with.
5A messy rotated matrix: 4 situations and fixes
Cross-loading item
Loads on two factors with a small gap (under 0.3 is a commonly used cut-off). Consider removing it, especially if the wording could be read two ways.
Low loading
The item reaches 0.5 on no factor. Usually a vague or off-topic question, and a candidate for removal.
Item jumps to another factor
An item from factor A sits squarely in factor B. Reread it: if that makes theoretical sense, you may rename the factor; if not, remove it.
Wrong number of factors
Two factors merge or one splits. Check eigenvalues, the scree plot and theory; you can fix the number of factors (Fixed number of factors) to test it.
- Remove the single worst item (heaviest cross-loading or lowest loading).
- Re-run the EFA, because the matrix changes every time.
- Repeat until every item loads ≥ 0.5 on one factor and KMO and variance explained pass.
- If a factor lost items, re-run Cronbach’s alpha for it.
Removing too many items can empty a concept of its meaning. Every removal needs a reason, statistical and content-based, and a record. This is a section committees love to question.
6How to report EFA in your thesis
“EFA on the 9 observed items of the independent variables, using Principal Components with Varimax rotation, gave KMO = 0.812 (> 0.5) and a significant Bartlett’s test (Sig. < .001), so the data was suitable for factor analysis. Three factors were extracted at an eigenvalue of 1.236, explaining 68.4% of the variance (> 50%). Item PV2 cross-loaded on two factors and was removed; all remaining items then loaded above 0.5 on their intended factors.”
Practice on the rotated matrix of your own model
The Light Data’s model canvas produces the SPSS tables (Cronbach’s alpha, KMO, the rotated matrix, correlation, regression) on simulated data shaped by the model you draw. It is a convenient way to get familiar with each table before you run real data. Simulated data is never for reporting.
- KMO ≥ 0.5 (ideally ≥ 0.8) · Bartlett Sig. < 0.05.
- Eigenvalue > 1 · variance explained ≥ 50%.
- Each item loads ≥ 0.5 on exactly one factor, with no cross-loading.
- Remove one item at a time, and re-run alpha if you removed any.